How to use DGSEA with your expression data
Now that we’ve installed and validated DGSEA, let’s test the algorithm with real data and generate enrichment plots.
In our manuscript, we used cellular response to hypoxia as a positive control to detect a shift towards glycolysis and away from oxidative phosphorylation. We used RNA sequencing data from 31 breast cancer cell lines subjected to 1% and 20% oxygen from:
Ye,I.C. et al. (2018) Molecular Portrait of Hypoxia in Breast Cancer: A Prognostic Signature and Novel HIF-Regulated Genes. Mol. Cancer Res. MCR, 16, 1889–1901.
I have truncated this data to only contain two of the 31 cell lines (MCF10A and MCF12A).
# Import data
library(RCurl)
data_in <- getURL("https://raw.githubusercontent.com/JamesJoly/DGSEA/master/MCF10A_MCF12A_Log2Ratio.csv")
data_in <- read.csv(text = data_in)
colnames(data_in)[1] <- "Gene"
# Reformat to the GSEA PreRanked format
MCF10A <- data_in[,1:2]
MCF12A <- data_in[,-2]# Import gene sets
library(GSA)
kegg.pathways <- GSA.read.gmt("https://raw.githubusercontent.com/JamesJoly/DGSEA/master/KEGG_metabolic_pathways.gmt")# Perform targeted analysis examining Core Glycolysis - OxPhos
library(DGSEA)
set.names <- kegg.pathways$geneset.names
targeted.MCF10A <- dgsea_targeted(MCF10A, kegg.pathways,
set.names[1], set.names[2])
targeted.MCF12A <- dgsea_targeted(MCF12A, kegg.pathways,
set.names[1], set.names[2])# Generate Mountain Plots
MCF10A.mtn.plot <- make_mountain_plots(targeted.MCF10A, set.names[1], set.names[2])
MCF10A.mtn.plot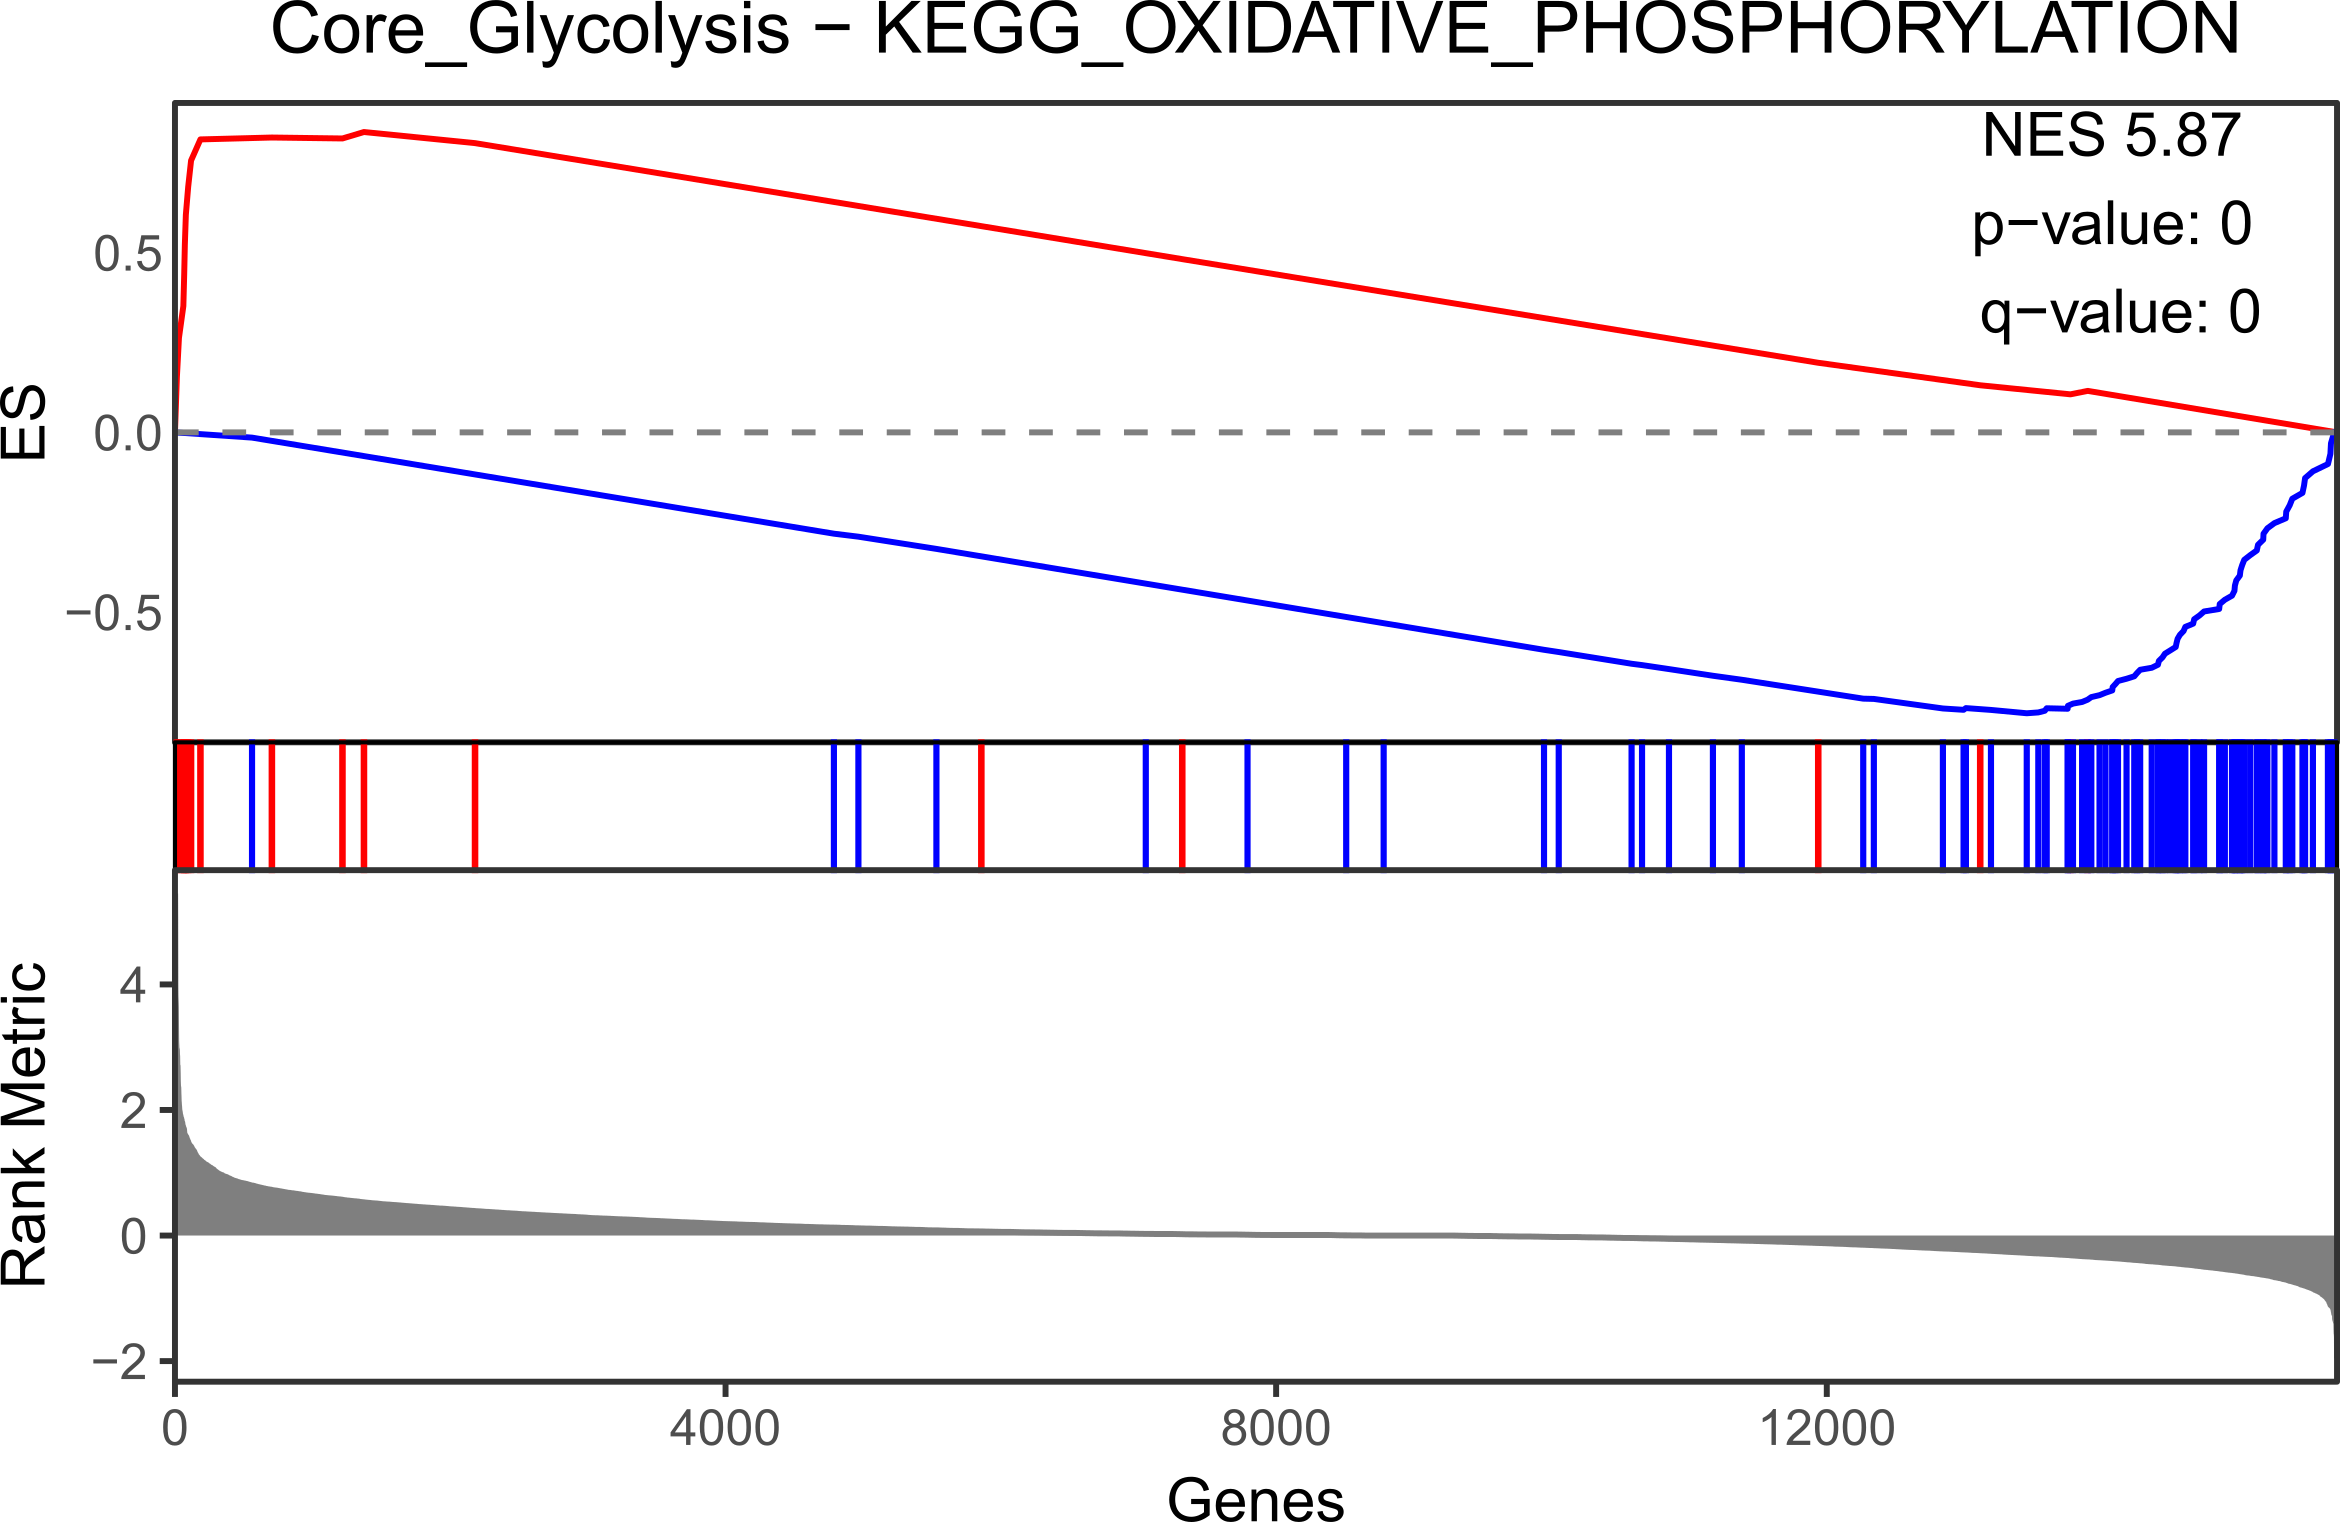
# Generate Mountain Plots
MCF12A.mtn.plot <- make_mountain_plots(targeted.MCF12A, set.names[1], set.names[2])
MCF12A.mtn.plot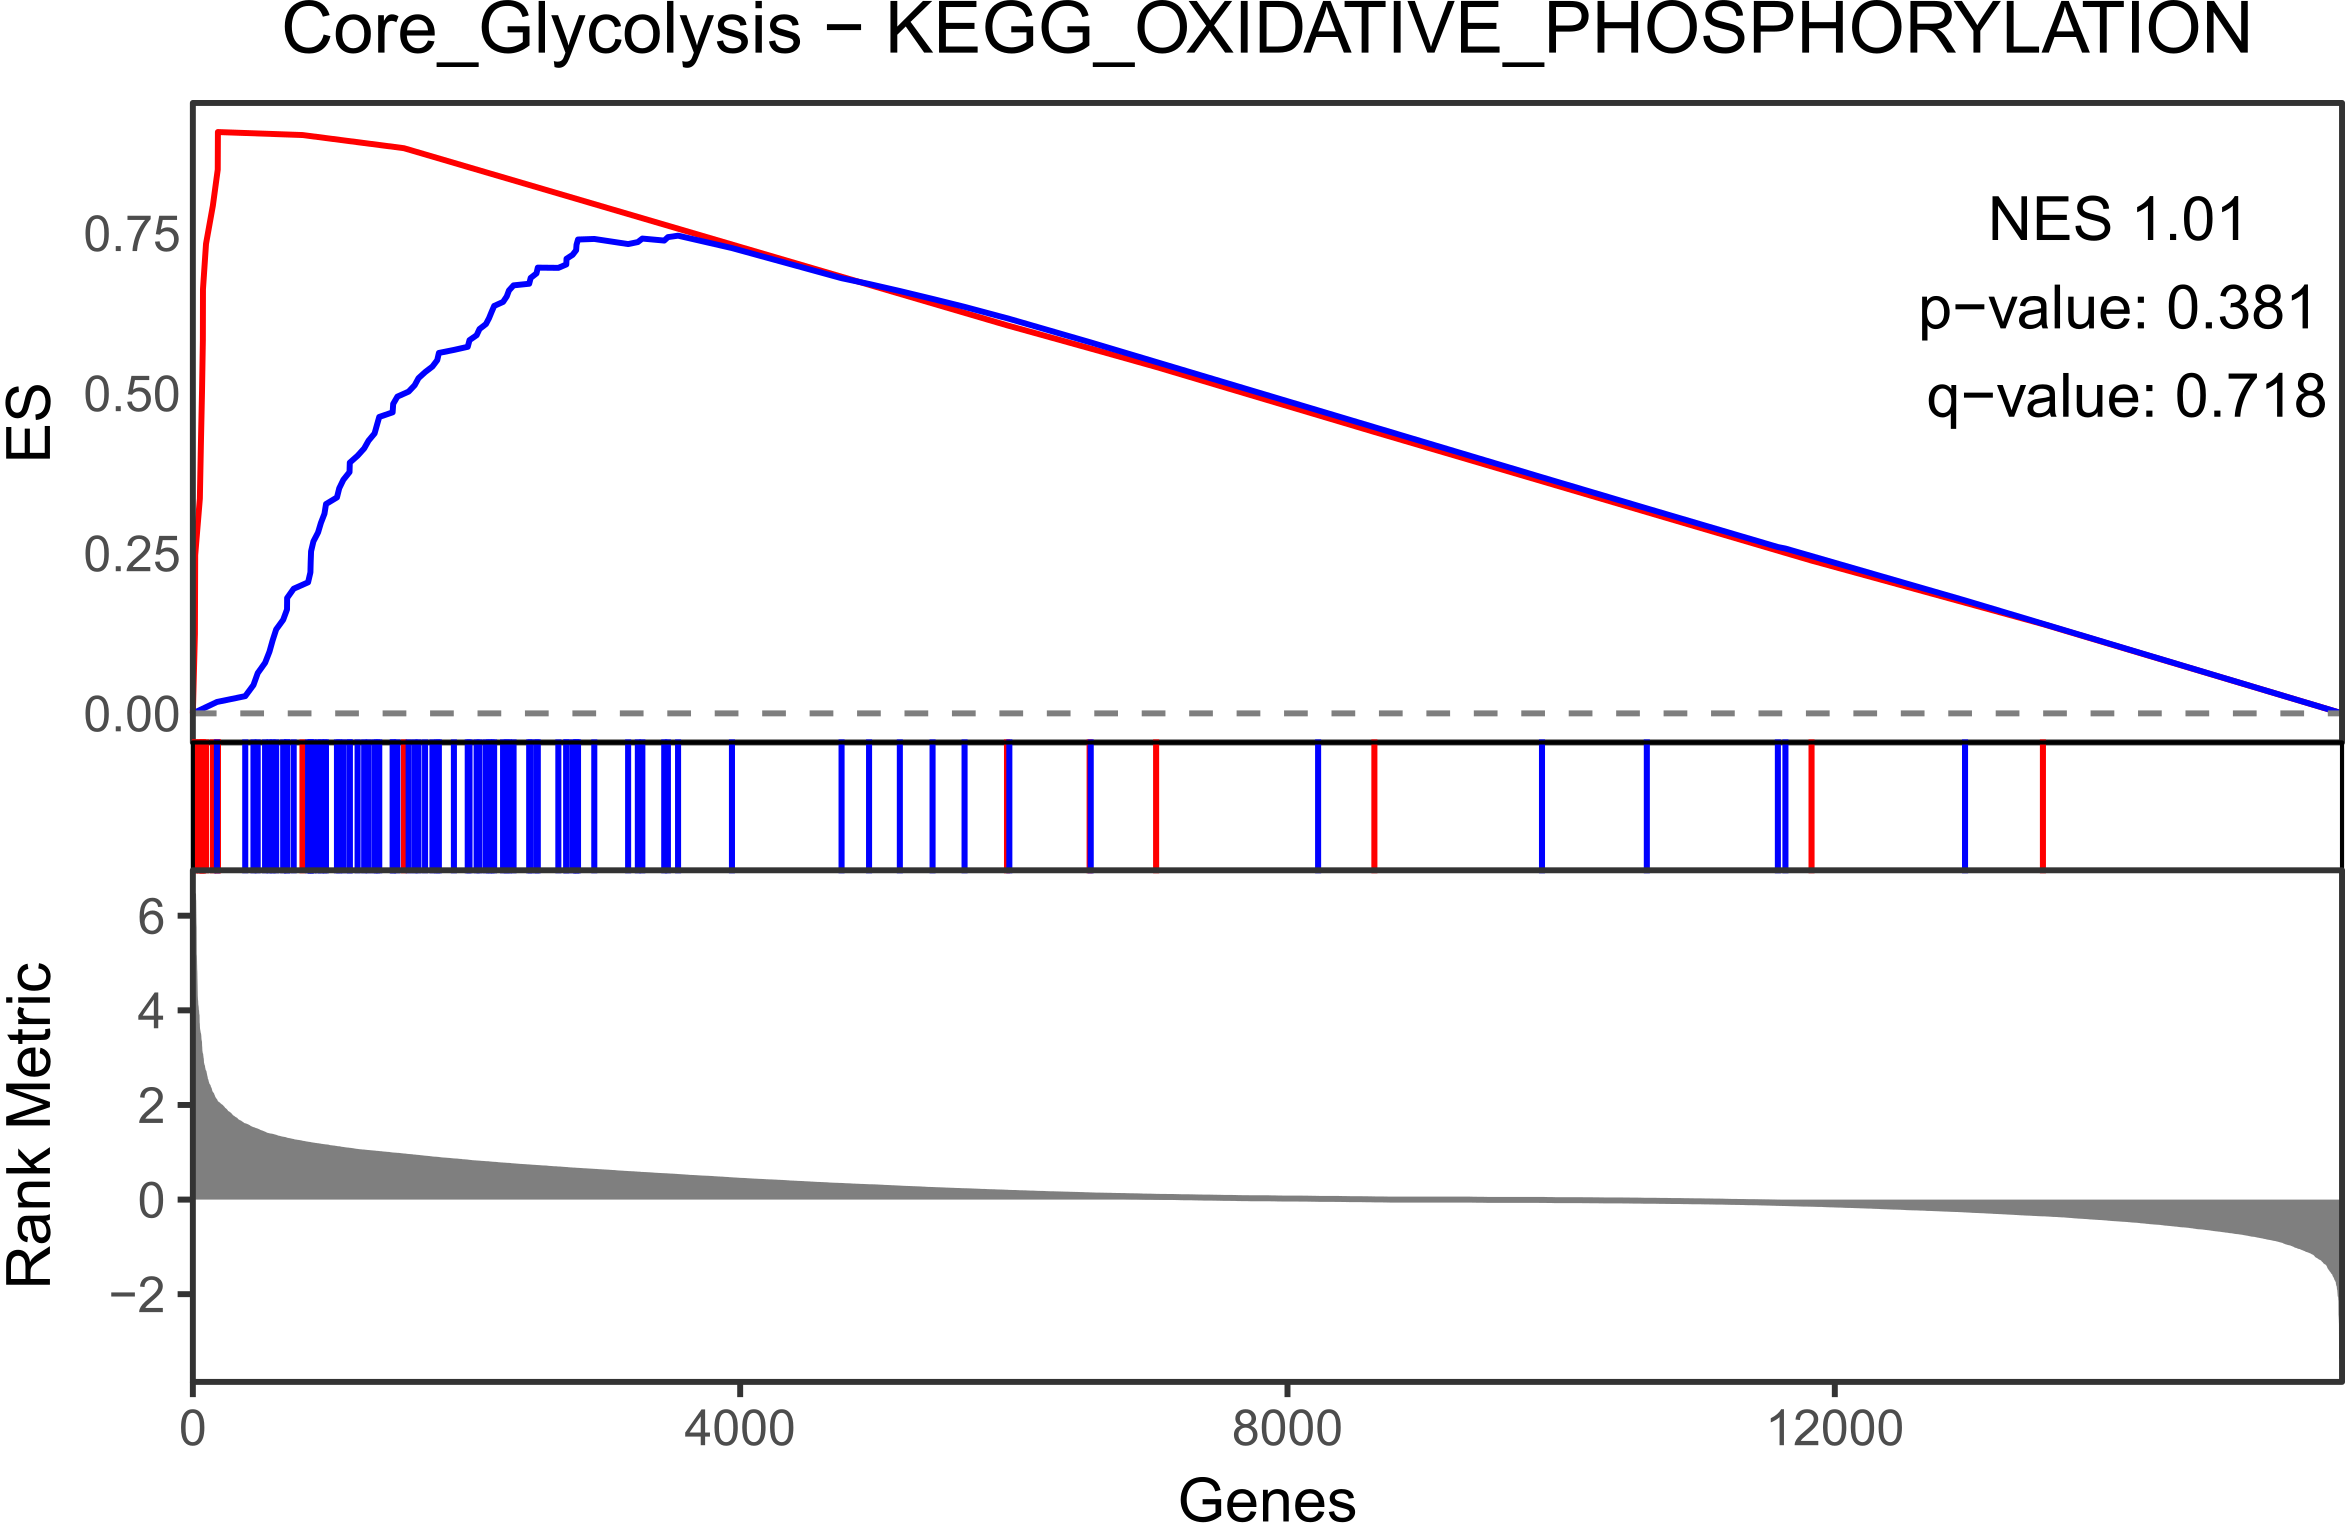
If you find DGSEA helpful, please cite us at:
Joly, J. H., Lowry, W. E., and Graham, N. A. (2020) Differential Gene Set Enrichment Analysis: A statistical approach to quantify the relative enrichment of two gene sets. Bioinformatics. 10.1093/bioinformatics/btaa658